Structural Analysis Through Interactive Visualization
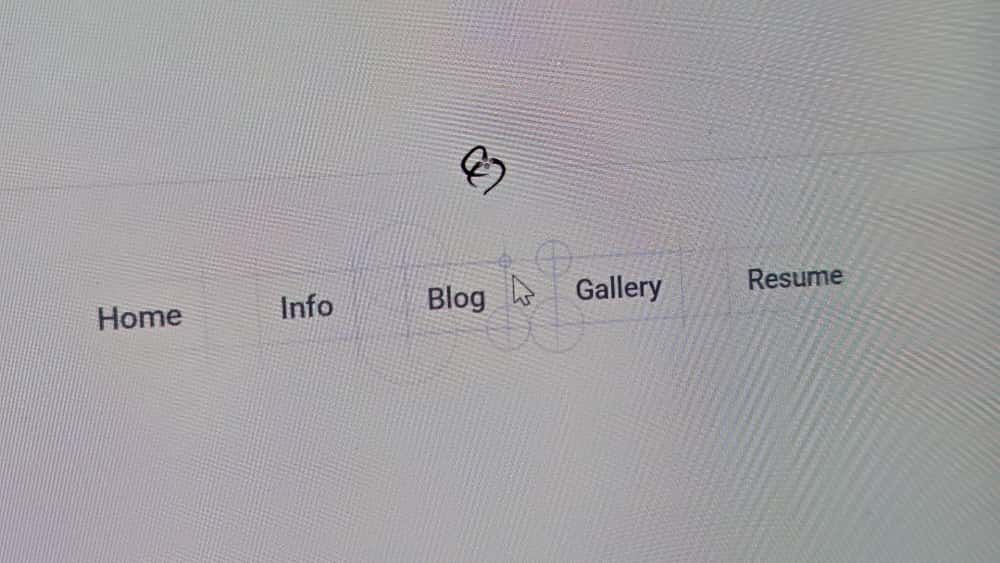
This website implements a hover-based visualization system that exposes the underlying DOM architecture of interactive elements. When users position their cursor over page elements, the system renders geometric representations of the underlying DOM, hilighting the structural relationships, creating a technical overlay that reveals the functional hierarchy of the interface.
The implementation utilizes pure JavaScript for cross-browser compatibility, with Vue.js composables providing the integration layer within this Nuxt-based site. The system operates independently of the framework, relying solely on native Canvas API operations and DOM coordinate calculations.
The Architecture: A Transparent Canvas Overlay
The implementation centers on a single transparent canvas element that positions itself above the entire page. When a user hovers over an element, the canvas repositions and resizes to frame that element, then renders the blueprint structure in real-time.
Performance characteristics:
- Single canvas strategy eliminates the overhead of multiple DOM overlays
- Canvas rendering utilizes hardware acceleration
- Dynamic positioning occurs without triggering DOM reflows
- Continuous redrawing maintains responsiveness during mouse movement
The system consists of three components:
- A Vue Composable (
useBlueprintGrid.ts): Manages canvas positioning and event coordination - A Drawing Utility (
drawBlueprint.ts): Handles geometric calculations and rendering operations - A Constants File (
blueprintConstants.ts): Defines color values for consistent visual presentation
Step 1: Centralizing the Style (blueprintConstants.ts)
To avoid magic numbers and scattered styles, we define our core colors in one place. This makes maintenance much easier.
// app/utils/blueprintConstants.ts
export const BLUEPRINT_COLOR_BASE = '120, 120, 130'
export const BLUEPRINT_COLOR_LINK = '65, 120, 160'
Step 2: Canvas Positioning and Event Handling (useBlueprintGrid.ts)
This composable controls the canvas overlay behavior. The implementation uses dynamic canvas repositioning rather than maintaining multiple canvas elements.
The event handling sequence:
handleMouseOver- Calculates new canvas dimensions and position relative to the target elementhandleMouseMove- Updates cursor coordinates and triggers rendering updatesredraw- Executes the drawing operations that compose the blueprint visualization
Canvas positioning implementation:
// Canvas repositioning to frame the target element
overlay.style.left = `${canvasLeft + window.scrollX}px`
overlay.style.top = `${canvasTop + window.scrollY}px`
overlay.width = canvasWidth * dpr  // Device pixel ratio scaling
The canvas repositions to create a precise overlay that corresponds to the element's dimensions, including additional space for line extensions.
// app/composables/useBlueprintGrid.ts
import { onMounted, onUnmounted } from 'vue'
import { drawBlueprintRect } from '~/utils/drawBlueprint'

export const useBlueprintGrid = () => {
  if (process.server) return

  let overlay: HTMLCanvasElement | null = null
  let ctx: CanvasRenderingContext2D | null = null
  let mouseX = 0
  let mouseY = 0
  let activeElement: HTMLElement | null = null
  let activeElementRect: DOMRect | null = null
  const padding = 30 // The bleed area

  const redraw = () => {
    if (!ctx || !overlay || !activeElement || !activeElementRect) return

    ctx.clearRect(0, 0, overlay.width, overlay.height)

    const overlayRect = overlay.getBoundingClientRect()
    const relativeMouseX = mouseX - overlayRect.left
    const relativeMouseY = mouseY - overlayRect.top

    // Draw the active element and all its children
    drawBlueprintRect(ctx, activeElement, overlayRect, relativeMouseX, relativeMouseY)
    const children = activeElement.querySelectorAll('*')
    children.forEach((child) => {
      drawBlueprintRect(ctx, child as HTMLElement, overlayRect, relativeMouseX, relativeMouseY)
    })
  }

  const handleMouseOver = (e: MouseEvent) => {
    const target = e.target as HTMLElement
    if (target === document.body || target === overlay || (overlay && overlay.contains(target))) return

    activeElement = target
    activeElementRect = activeElement.getBoundingClientRect()

    if (!ctx || !overlay) return

    const dpr = window.devicePixelRatio || 1
    overlay.width = (activeElementRect.width + padding * 2) * dpr
    overlay.height = (activeElementRect.height + padding * 2) * dpr
    ctx.scale(dpr, dpr)

    overlay.style.width = `${activeElementRect.width + padding * 2}px`
    overlay.style.height = `${activeElementRect.height + padding * 2}px`
    overlay.style.top = `${activeElementRect.top + window.scrollY - padding}px`
    overlay.style.left = `${activeElementRect.left + window.scrollX - padding}px`
    overlay.style.opacity = '1'

    redraw()
  }

  const handleMouseOut = () => {
    if (overlay) overlay.style.opacity = '0'
    activeElement = null
    activeElementRect = null
  }

  const handleMouseMove = (e: MouseEvent) => {
    mouseX = e.clientX
    mouseY = e.clientY

    if (!overlay || !activeElement) return

    const rect = overlay.getBoundingClientRect()
    const relativeX = mouseX - rect.left
    const relativeY = mouseY - rect.top

    const mask = `radial-gradient(circle 200px at ${relativeX}px ${relativeY}px, black 0%, transparent 100%)`
    overlay.style.maskImage = mask
    overlay.style.webkitMaskImage = mask

    redraw()
  }

  onMounted(() => {
    // ... canvas setup and event listener attachment ...
  })

  onUnmounted(() => {
    // ... cleanup ...
  })
}
Step 3: Geometric Rendering and Coordinate Translation (drawBlueprint.ts)
The drawing utility performs coordinate translation and geometric rendering operations. Canvas drawing operations execute in real-time during cursor movement.
DOM-to-Canvas coordinate mapping:
// Translate DOM element positions to canvas coordinate system
const x = elRect.left - overlayRect.left  // Canvas-relative X position
const y = elRect.top - overlayRect.top   // Canvas-relative Y position
The system examines DOM structure and converts interactive elements (<a>, <button>, etc.) into corresponding geometric representations.
Interactive circle calculations: The corner indicators implement distance-based mathematical relationships:
const dist = Math.sqrt(Math.pow(cx - mouseX, 2) + Math.pow(cy - mouseY, 2))
const proximity = Math.max(0, 1 - (dist / (maxRadius * radiusDivisor)))

// Inverse scaling: distant cursor produces larger radius
const radius = Math.min(maxRadius, (1 - proximity) * maxRadius * 1.2)
const opacity = proximity * cicleOpacity  // Proximity increases visibility
This produces circles that expand with cursor distance while increasing opacity with cursor proximity, creating responsive visual feedback based on geometric relationships.
// app/utils/drawBlueprint.ts
import { BLUEPRINT_COLOR_BASE, BLUEPRINT_COLOR_LINK } from '~/utils/blueprintConstants'

export const drawBlueprintRect = (ctx: CanvasRenderingContext2D, el: HTMLElement, overlayRect: DOMRect, mouseX: number, mouseY: number) => {
  const elRect = el.getBoundingClientRect()
  const x = elRect.left - overlayRect.left
  const y = elRect.top - overlayRect.top
  const w = elRect.width
  const h = elRect.height
  const extension = 15

  const isClickable = el.closest('a, button, input, textarea, select, option')
  const colorBase = isClickable ? BLUEPRINT_COLOR_LINK : BLUEPRINT_COLOR_BASE

  const solidColor = `rgba(${colorBase}, 0.25)`
  const transparent = `rgba(${colorBase}, 0)`
  const maxRadius = 30
  const radiusDivisor = 3
  const cicleOpacity = 0.3

  // Draw the solid box & extensions...
  // ... (code for drawExtension)

  const drawIntersectionCircle = (cx: number, cy: number) => {
    const dist = Math.sqrt(Math.pow(cx - mouseX, 2) + Math.pow(cy - mouseY, 2))

    // Proximity: 1 = close, 0 = far
    const proximity = Math.max(0, 1 - (dist / (maxRadius * radiusDivisor)))

    const radius = Math.min(maxRadius, (1 - proximity) * maxRadius * 1.2)
    const opacity = proximity * cicleOpacity

    if (radius <= 1.5 || opacity <= 0) return

    ctx.beginPath()
    ctx.arc(cx, cy, radius, 0, 2 * Math.PI)
    ctx.strokeStyle = `rgba(${colorBase}, ${opacity})`
    ctx.lineWidth = 1
    ctx.stroke()
  }

  // Draw all components
  // ... (calls to drawExtension and drawIntersectionCircle)
}
Performance Characteristics and Implementation Results
Architectural advantages of this approach:
- Single canvas implementation - Eliminates the computational overhead of multiple DOM overlay elements
- Hardware-accelerated rendering - Canvas operations utilize GPU acceleration for consistent frame rates
- Efficient repositioning - Canvas manipulation avoids triggering expensive DOM reflow calculations
- Direct coordinate translation - Mathematical conversion from DOM positions to canvas coordinates
- Continuous rendering updates - Interactive elements respond to cursor movement without performance degradation
Implementation outcome: The system reveals the structural relationships within web pages through computed geometric representations and real-time coordinate mathematics. The approach transforms standard web interfaces into technical drawings that expose their underlying interactive architecture.
The effect converts webpage elements into precise geometric representations, where cursor interaction reveals structural details with the accuracy of architectural documentation and the performance characteristics of hardware-accelerated graphics rendering.